
Hearing Loss Profiling and SAC/SOAC
Purpose
Hearing loss profiling is a way of placing a given hearing loss into an exclusive category and then describing the hearing loss in terms of communication, use, and satisfaction parameters.
Parameters
|
Unaided Condition
|
Aided Condition
|
|
|
Pure Tone Group (PTG) Definitions
How were these hearing loss categories created?
The data used to establish these profiles came from over 1200 cases of unaided persons tested at health fairs where threshold and profile information was collected. The use and satisfaction profile information is based on 450 hearing aid users fit with instruments just prior to the 1990's. It is our intention to add more use and satisfaction data with current hearing aid technology as well as incorporate word recognition considerations, as more data are gathered in our own and other cooperating clinics.
In evaluating the person's communication difficulties and satisfaction with hearing aid use we have reasoned that the better ear thresholds (performance) will most closely approximate the person's overall skill in everyday situations.
Self report data were available on approximately 3000 subjects. These were passed through a pass/fail screening filter to separate out failures. The subjects failed the screening if any threshold exceeded 25 dB at 1 or 2k Hz or 30 dB at 4k Hz. There were 1243 who failed this screening.
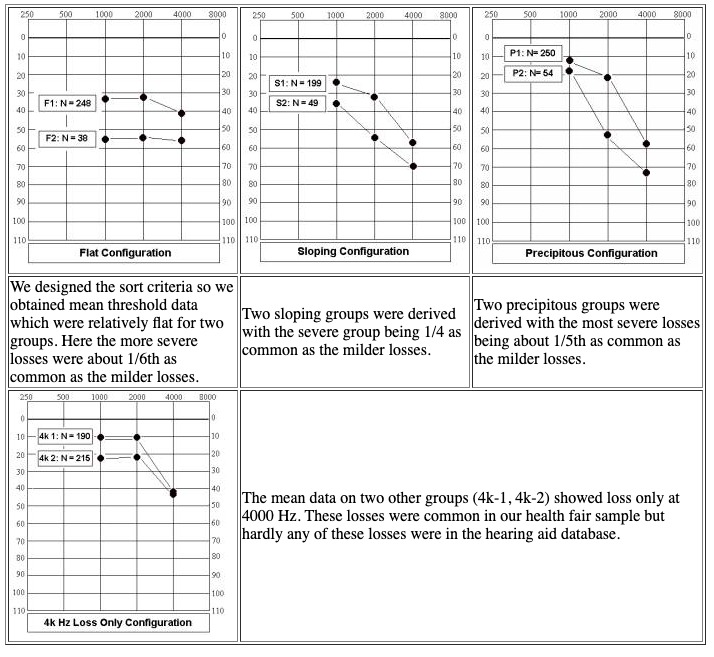
Using two points on the audiogram (1k Hz and 2/4k Hz average) we generated eight exclusive categories of hearing loss from among the health fair screens who failed. The sorting criteria were as follows:
Flat configurations:
An "F-1" includes thresholds at 1k that are 30-45 dB and 2-4k average less than or equal to 55 dB.
An "F-2" includes thresholds at 1k that are greater than or equal to 50 dB.
Sloping configurations:
An "S-1" includes thresholds at 1k that are 20-25 dB and 2-4k greater than 35 dB and less than or equal to 55 dB.
An "S-2" includes thresholds at 1k that are 40-45 and 2-4k average greater than 55 dB.
Precipitous configurations:
A "P-1" includes thresholds at 1k that are less than or equal to 15 dB and 2-4k average that is greater than 30 and less than or equal to 55 dB.
A "P-2" includes thresholds at 1k that are less than or equal to 35 dB and 2-4k average that is greater than 55 dB.
Minimal loss configurations:
A "4k-1" includes thresholds at 1k that are less than or equal 15 dB and a 2-4k average that is less than or equal 30 dB.
A "4k-2" includes thresholds at 1k that are greater than or equal to 20 dB and less than or equal to 25 dB and 2-4k average that is less than or equal to 35 dB.
Using these criteria we found two flat, two sloping, and two precipitous patterns of common hearing loss, plus two other patterns that showed almost normal hearing except at 4000 Hz. We surmise that these eight different patterns of loss are sufficient to classify nearly all common hearing losses in the population (see figure A). Future research may show further division based on speech in noise scores.
Figure A: Pure Tone Groups
Health Fair Data
Introduction to the Self Assessment of Communication (SAC) Tools
This is an introduction to the Self Assessment of Communication (SAC) and the Significant Other Assessment of Communication (SOAC) which are self report questionnaires designed to measure the effect of hearing loss and hearing aid outcomes. The SAC and SOAC were developed and first used at Idaho State University. These self report questionnaires were first introduced in the professional literature by Schow and Nerbonne (1982). This initial article in Ear and Hearing contained copies of the ten item SAC and the ten item SOAC. It also contained a report on the first test-retest reliability study which was a theses completed by Beverly Short on 50 subjects in 1982. Short found a .80 reliability for SAC and .90 for SOAC (1982 paper-pencil version).
Other studies and reports on SAC and SOAC were performed/presented/published all through the 1980s and 1990s. In 2001 Brockett and Schow created the present web site which was announced in the Hearing Journal as part of a Page Ten article. One of the major aspects on this site since 2001 has been the system of Pure Tone Groups (PTGs) which when used with an audiogram, transform the better ear threshold data into one of 8 exclusive PTGs based on the degree of loss and the slope of loss. There are 2 flat losses, 2 sloping losses, 2 precipitous losses and 2-4K only losses (See link for the details on this system).
On this site the results from SAC and SOAC are summarized to show how these different losses influence communication abilities as compared to those with normal hearing. This site has now been updated to reflect a recent study on a computerized version of SAC/SOAC. This computerized version of SAC and SOAC used as the starting point a slightly updated version of SAC/SOAC as introduced by Schow and Nerbonne (2007) in the 5th Edition of their text, Introduction to Audiologic Rehabilitation. The updated version of SAC/SOAC contains essentially the same items as before, but two items were eliminated (from the earlier 6 disability/activity items) with one being replaced by an open ended disability/activity item and one replaced by a quality of life measure in the handicap / participation section. Further, a single item for satisfaction and use has been added (made possible by combining the earlier items 9 and 10).
The computerized versions of SAC/SOAC are called flashSAC and the flashSOAC have the same format and qualities of the original versions, with items asking about communication and a five item response format. These improvements were initially designed to be used for the HEARx versions of SAC/SOAC and findings from HearX are reported on this site. In-depth comparisons between the two versions have not been completed but the two versions are almost identical and mean data on total scores suggest the two versions will yield similar total scores. The combined database described in B uses both the 1982 and the 2007 versions and shows very similar total score performance on most of the PTGs. As noted in E we suggest using different critical difference (CD) values for paper-pencil and computerized versions because of the different format and test-retest reliability but the data suggest that the 1982 and 2007 versions will yield similar scores on a normative basis.
SAC and SOAC Unaided Means Based on PTGs
By combining our database of various studies and using the original items that are also continuing items we have produced mean and 10%-90% range data for preliminary normative purposes. Some of these data were reported in 2005 by Schow, et al. but we have enlarged the database on this website. These findings show results when hearing aids are not used. Later we present outcome data for hearing aid users by PTG. There are three major samples contained in this combined database (See Figure B).
The first sample has the responses from a large health fair study which was performed at numerous locations throughout Idaho. In this sample we gathered a very large database of over 6000 persons from the general population who came to health fairs to have their hearing tested. About half, (n=3346) were found to have hearing loss based on a fence at 25 dB at 500, 1000, and 2000 Hz and 30 dB at 4000 Hz. See the support for this fence in adult hearing screening as shown in Schow (1991, Ear and Hearing). A portion of the health fair sample (n=1243) filled out SAC (1982) questionnaires and became part of our SAC mean and range data.
A second sample came from the HEARx company which is a major hearing aid dispenser located in 4 states (CA, AZ, NY, FL). The HEARx company in 2003 picked the 1982 SAC/SOAC as the best outcome tool after trying out 20 different self report outcome measures. The data summarize 286 persons fit by hearing aids in a HEARx sample.
A third sample contained here involves a stratified sample of 60 and their significant others who filled out the new 2007 computerized versions of SAC/SOAC in the summer of 2007 (Hodes, Schow, Brockett, 2009).
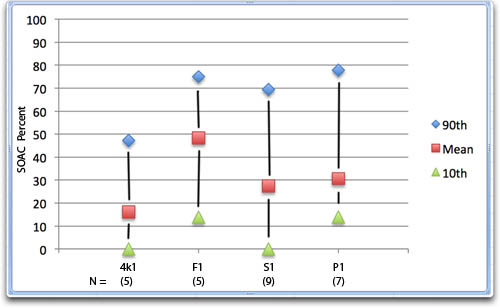
These three samples are in our SAC/SOAC database with information on age, gender, and hearing loss. All 3 data sets were sorted into PTGs and Figure B shows the mean SAC score for each of the three samples. The fourth bar in each graph shows the SOAC scores sorted into PTGs as obtained from only the computerized study. We have much more limited SOAC data, but fortunately the means are shown to correspond closely to SAC data. Figure C-1 shows the means of SAC scores for the 3 samples (when scores, ages and genders are combined). To be included in this graph N's of 5 or more were selected. Figure C-2 shows the SOAC scores. Section D, Figures 1-4, shows pure tone data.
In Figure B, the normal hearing means fall nicely in the middle of the normal range (0-20%). The hearing loss means cluster nicely for most PTGs (4k1, 4k2, F-2, S-1, P-1, P-2). For F-1 and S-2 there is more spread, but this seems to be explainable due to some small samples. By combining all data into a total data set, we have derived useful information for those who use SAC and SOAC in other settings and wish to have preliminary norms. Look for these in section C and Figures C-1 and C-2. Figure B shows how SAC and SOAC scores for different hearing losses (PTGs) will need to be reduced when aided to bring scores closer to or within normal limits (0-20%).
Figure B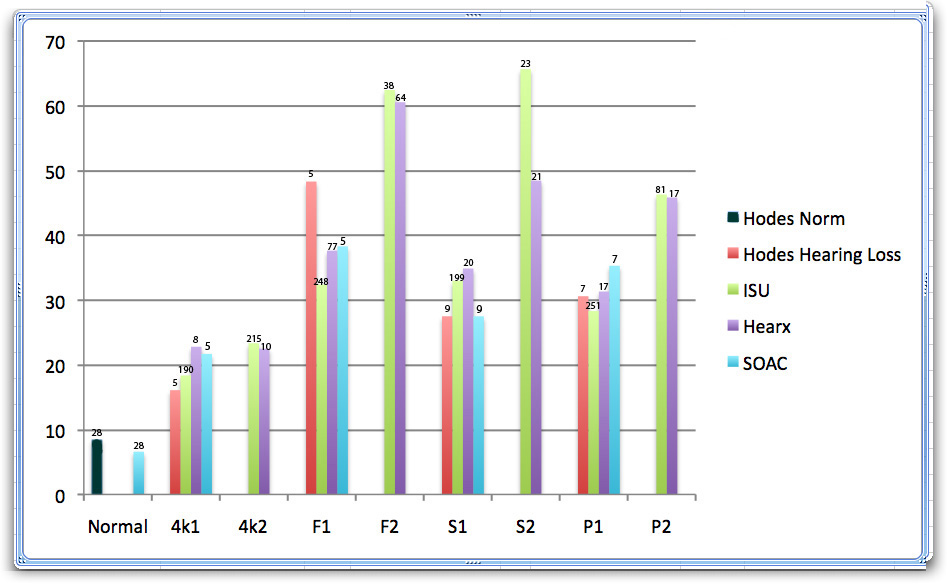
SAC and SOAC Unaided Means and Range Data
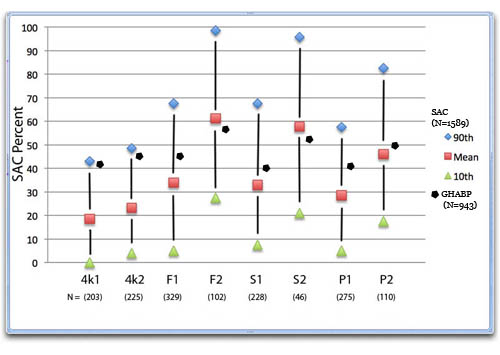
In order to simplify these findings we have collapsed all three samples into one database and show mean and 10-90 percentile ranges for both unaided SAC (Figure C-1) and unaided SOAC (Figure C-2) data.
We have also shown in Figure C-1 for comparison purposes the mean unaided data as gathered by Gatehouse using the Glasgow Hearing Aid Benefit Profile (GHABP) (using 4 similar disability/activity items and 1 handicap/participation item weighted 6:4 as in SAC/SOAC). These are reported in terms of our 8 PTGs. As noted the means are quite similar except for 4k-1 and 4k-2 and all the UK mean data fall within the SAC ranges.
Figure C-1
|
PTG
|
10th %tile
|
Mean
|
90th %tile
|
| 4k1 | 0.0 | 18.5 | 43.0 |
| 4k 2 | 4.0 | 23.2 | 48.5 |
| Flat 1 | 5.0 | 33.9 | 67.5 |
| Flat 2 | 27.5 | 61.2 | 98.5 |
| Slope 1 | 7.5 | 32.9 | 67.5 |
| Slope 2 | 21.0 | 57.7 | 95.7 |
| Precip 1 | 5.0 | 28.5 | 57.5 |
| Precip 2 | 17.5 | 46.0 | 82.5 |
Figure C-2
|
PTG
|
10th %tile
|
Mean
|
90th %tile
|
| 4k1 | 0 | 16.1 | 47.2 |
| Flat 1 | 13.8 | 48.3 | 75.0 |
| Sloping 1 | 0 | 27.4 | 69.4 |
| Precipitous 1 | 13.9 | 30.6 | 77.8 |
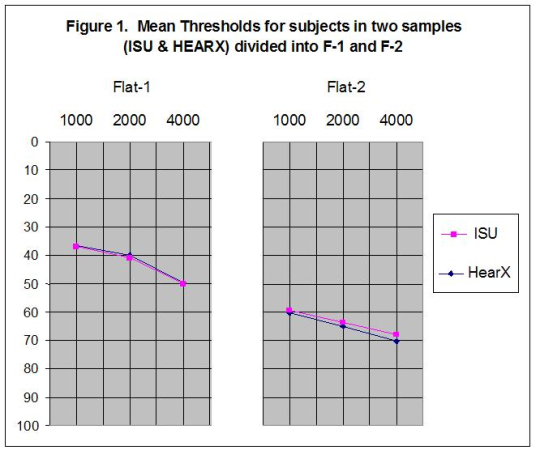
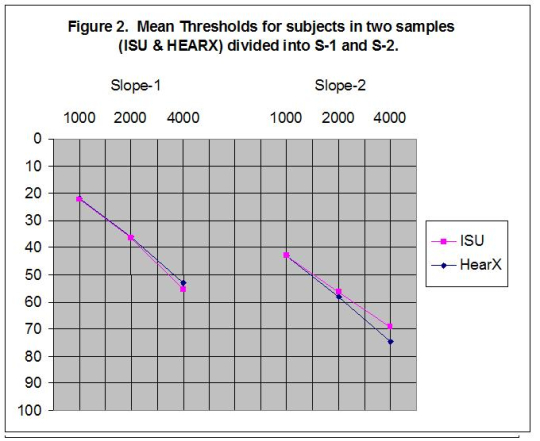
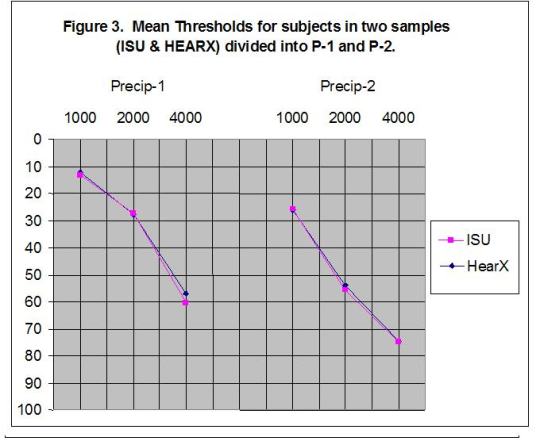
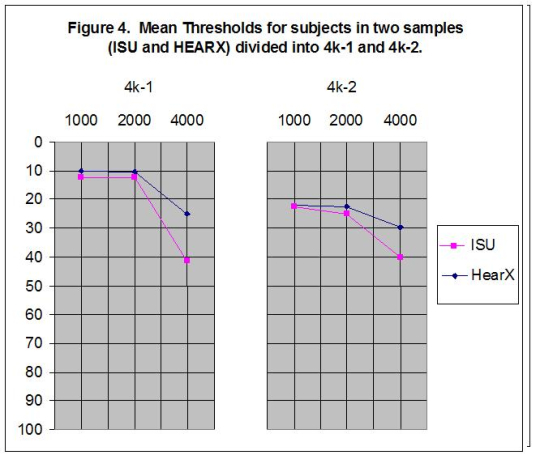
Pure Tone Data Based on PTGs
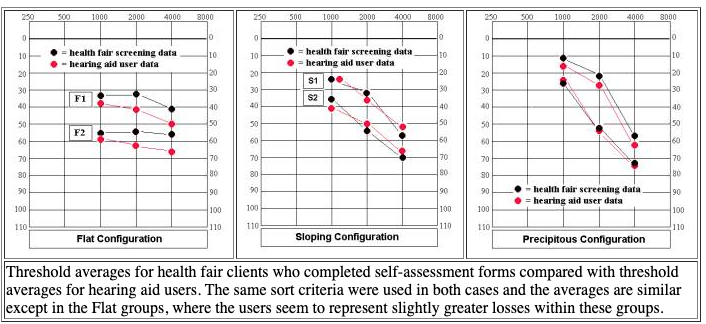
We submit that the distribution of unaided mean scores for SAC and SOAC are more useful because they are different for each of the eight PTGs. As noted in section C, the GHABP data also are quite different across the PTGs. By using PTGs we know the effect on unaided communication for various degrees and configurations of hearing loss. The mean hearing thresholds for the subjects in the HEARx data and our n=1243 data sets were compared after classifying them into the 8 PTGs. As can be seen in Figures 1-4, they were very similar and show the value of using the exclusive grouping of PTGs.
Computerized SAC and SOAC Versions and Critical Difference (CDs)
We recommend use of the 2007 computerized versions of SAC (flashSAC) and SOAC (flashSOAC) whenever possible for pre and post testing (outcome measures).. The standard deviations (SDs) and test-retest correlations (r) from our data set of 60 were used to calculate standard error of measurement (SEM) and critical differences (CD). CD's were found to be 5.2 (14.4%) for SAC and 4.0 (11.2%) for SOAC. The CDs we have for paper pencil versions of SAC/SOAC are from the original study by Short. They are 23% for SAC and 16% for SOAC. These 1982 paper pencil CDs are slightly larger partly because the test-retest correlations were not as good. This is typical for other CD numbers to be higher on paper and pencil versions as reported by Holcomb and Punch (2006) and Weinstein, Spitzer, and Ventry (1986). If the CD number or % is subtracted from the unaided pre-test score, any number or % smaller than this result, on the outcome score is considered to be significant at the 95% confidence interval for true change. For example, if the computerized SAC pre-test equals 50%, and the post-test outcome score = 35% this is a significant difference.
|
Correlations (r)
|
Critical Differences
|
|||||
|
SAC
|
SOAC
|
SAC
|
SOAC
|
|||
|
Num
|
%
|
Num
|
%
|
|||
|
Pencil/Paper
|
.80
|
.90
|
9.0
|
23.0
|
6.5
|
16.0
|
|
Computerized
|
.94
|
.97
|
5.2
|
14.4
|
4.0
|
11.2
|
We recommend use of the following scale for interpretation of percent scores of either paper-pencil or computerized versions (both 1982 and 2007 versions).
|
0-20 %
|
No disability or handicap |
|
21-40 %
|
Slight hearing disability or handicap |
|
41-70 %
|
Mild to moderate disability or handicap |
|
71-100 %
|
Severe hearing disability or handicap |
To convert raw scores to percent, divide the raw score total by the number of items (such as 9 items in the total or 5 items for the disability section). Then, subtract 1 and multiply x 25 = %.
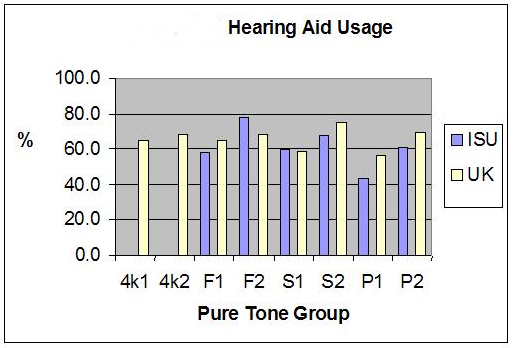
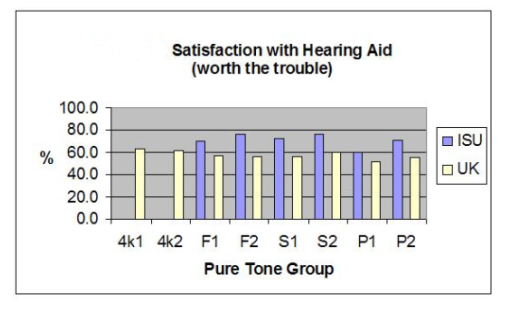
SAC and SOAC Outcome Data
So far we have only limited outcome data on benefit after hearing aid use using SAC/SOAC. These are shown in these two Figures and are confined to measures of use and satisfaction.
3. Hodes, M., Schow, R., & Brockett, J. (2009). New support for hearing aid measures: The computerized SAC and SOAC. Hearing Review, 16, 26-36.