
ISU and ARS researchers improve method to measure soil carbon at National Science Foundation Reynolds Creek Critical Zone Observatory in Southwest Idaho
April 23, 2019
POCATELLO – There is two to three times as much carbon in the Earth’s soil than in its atmosphere, which has important implications with regard to the effects of climate change, and scientists working at the National Science Foundation’s Reynolds Creek Critical Zone Observatory in southwest Idaho have developed a better method for estimating soil carbon.
“Carbon storage at the Earth’s surface is an important process that helps regulate atmospheric carbon dioxide,” says Richard Yuretich, a program director in the National Science Foundation’s Division of Earth Sciences, which funded the research. “This study unveils a method of better estimating the carbon content in Earth’s surface, and allows for more accurate modeling and prediction of carbon cycling through ecosystems and the atmosphere.”
 The study was completed by researchers from Idaho State University and the United States Department of Agriculture Agricultural Research Service. The title of the study is “Topographic controls of soil organic carbon on soil-mantled landscapes” and has been published in the journal Scientific Reports. The paper’s lead authors were ISU’s Kathleen Lohse, associate professor of biological sciences and geosciences, and former ISU Ph.D. student Nicholas Patton, now at the University of Queensland in Australia.
“In our study we were able to show we could explain about 94 percent of the variation in soil carbon at a really fine scale at three meters resolution and explain the variation in soil carbon across a landscape,” Lohse said.
This is important for a number of reasons including that small changes in the amount of carbon stored in the soil, owing to climate change conditions, could have profound effects on atmospheric carbon concentrations, Lohse said.
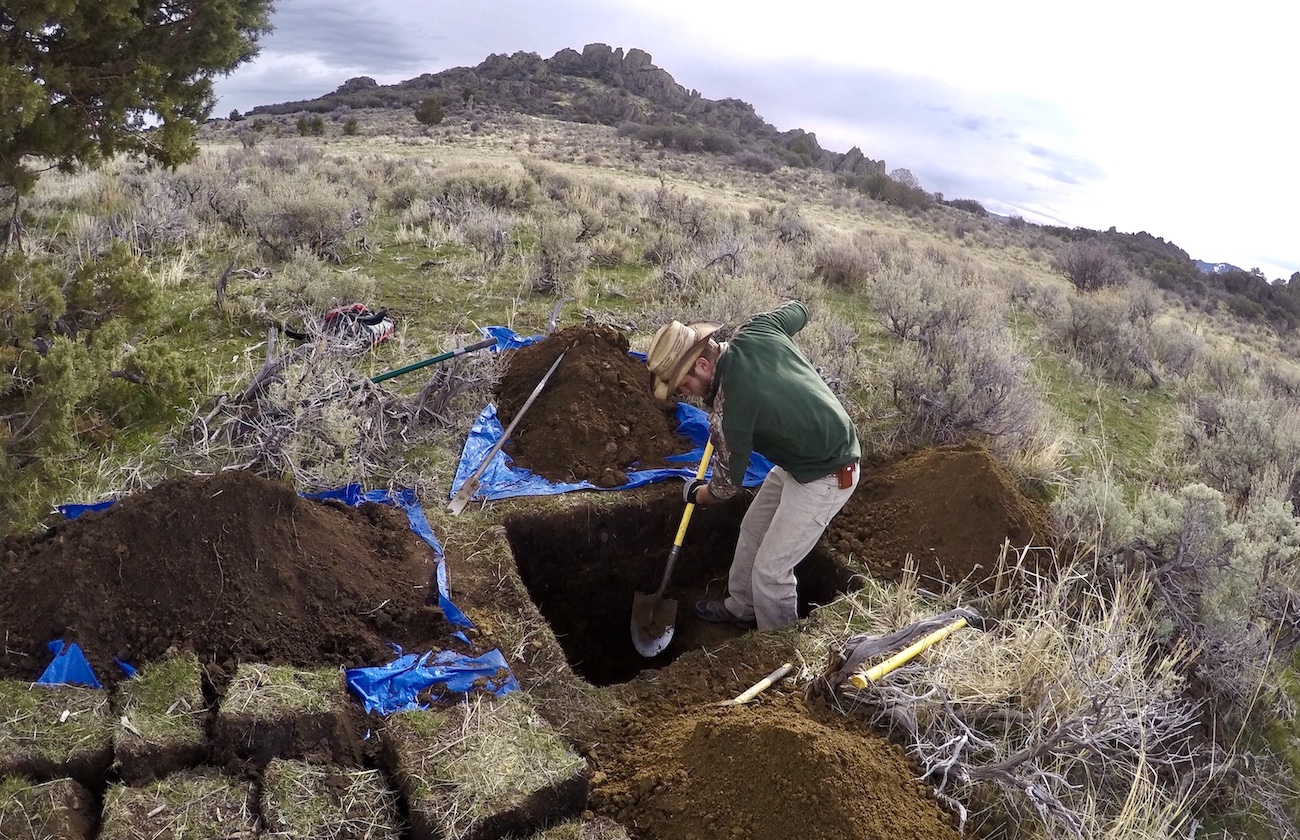
Digging soil pits and using LIDAR (Light Detection and Ranging, remote sensing satellite) data, the researchers examined much deeper soil depths, down to as much as 2-1/2-meters, than what normally has been examined. Generally, previous studies examined soil down to about a foot to three feet deep.
“We tried to quantify that soil carbon down through the whole soil column and we actually showed that if we don’t quantify that deeper carbon that we wouldn’t be accounting for all the carbon on the landscape,” Lohse said. “We would be underestimating if we just based carbon estimates on 30 (about a foot) centimeters depth. We would underestimate the total amount of carbon on the landscape by 50 percent, which is huge.”
 There estimates were applied across and entire watershed catchment of about 1.25-square mile area, and can be applied to much larger areas.
“This really allows us to improve predicts of soil carbon across these landscapes and it can be utilized by practitioners or scientists to estimate the total carbon pools at a local or regional scale,” Lohse said.
The scientists collected data from about 40 soil pits in the Reynolds Creek Critical Zone Observatory and then tested the results of the carbon found in the pits against the results estimated by the LIDAR data. In the process, the scientists discovered a new method to measure soil carbon that can be used by practitioners to estimate total catchment soil carbon that requires just one or two soil pits to estimate this total soil carbon within a catchment. The key is locating the pits at the right place in the catchment, or water basin.
“So now, instead of going out and arbitrarily digging a soil pit anywhere, you can strategically go out dig a pit and use LIDAR data to get more accurate estimates of soil carbon content,” Lohse said.
This new study compliments several other new studies coming out from the NSF’s Reynolds Critical Zone Observatory.
“The reason the Reynolds Creek CZO has been so successful is because of the partnership with the USDA, the ARS and the Northwest Watershed Research Center,” Lohse said. “Basically the people at the ARS have been so fantastic to collaborate with. It has been a really great partnership.”
The Reynolds Creek CZO includes the USDA’s Reynolds Creek Experimental Watershed that the ARS has run for the past 50 years, instrumenting the 150-mile-square watershed. Among other features the area has about 40 climate stations, 10 weirs and snow measuring stations.
“Basically we were able to come on board with the Critical Zone Observatory with the incredible amount of long term and spatially extensive data that was already being monitored and we’ve had the incredible opportunity to build on that template,” Lohse said.
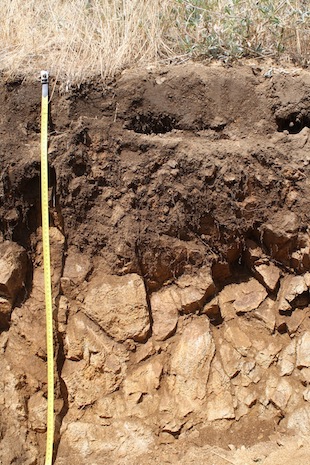
Photo information: Middle photo, Kathleen Lohse; bottom photo, soil pit on south facing aspect in Johnston Draw, Reynolds Creek CZO.
Categories: